
Symptom Tracking: How I Learned to See Patterns in My MCAS
When I first started trying to understand my MCAS, one of the most overwhelming — and ultimately most helpful — things I began doing was tracking my symptoms.
At first, I struggled to find the motivation. The whole process felt almost impossible. There were just too many variables. How could I ever find meaningful patterns when everything from food, temperature, pollen, mold, atmospheric pressure, rain, sleep, stress, and exercise could potentially trigger symptoms?
Making matters even more complicated is the cumulative nature of MCAS triggers.
You might be living in a moldy environment and only experiencing mild symptoms. Then one day you eat high-histamine leftovers and suddenly have a major flare. But the leftovers alone may not have actually been the entire problem. Without the ongoing environmental stress from mold, your body might have tolerated them just fine.
This idea is often referred to as the “bucket theory” of MCAS.
The basic concept is that triggers build on top of one another until they exceed your body’s ability to compensate — your “bucket” overflows — and symptoms begin to appear.
Once I started viewing my symptoms through that lens, tracking suddenly became much more valuable.
The goal was no longer to find one perfect trigger. Instead, I started trying to identify:
1. the triggers I could control,
2. the triggers I couldn’t,
3. and the combinations that seemed to push me over the edge.
Over time, I found that reducing controllable triggers — things like food choices, sleep quality, and environmental exposures inside my home — often helped me better tolerate the things I couldn’t easily control, like pollen, humidity, storms, or seasonal changes.
And in my case, those patterns eventually became significant enough that my family and I decided to begin planning our Nomad Year experiment to search for a healthier environment.
The Tracking System I Use
When I first started trying to understand my MCAS, one of the biggest challenges was simply figuring out what to track.
MCAS can be influenced by so many different factors that it can feel overwhelming. Food, pollen, mold, humidity, temperature, storms, air quality, sleep, stress, exercise, medications, and dozens of other variables can all potentially affect symptoms. I also wanted a way to score each location we visit during our Nomad Year where we are traveling the country to see which locations improve my MCAS symptoms.
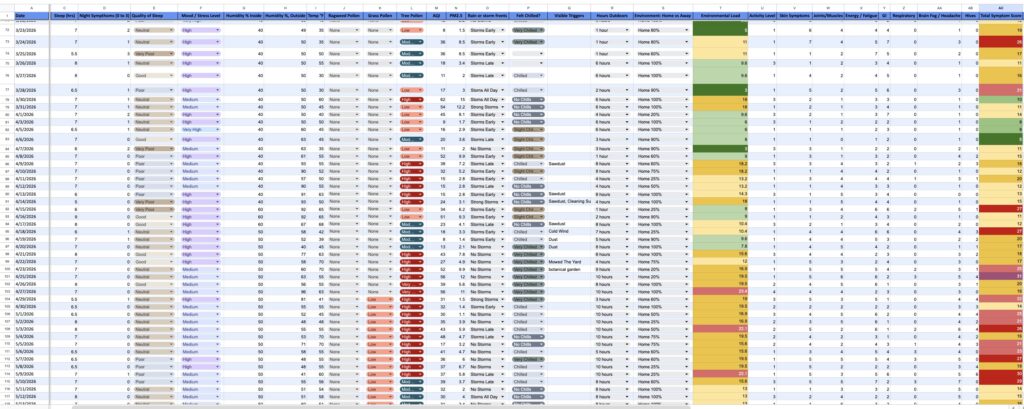
To build my tracking system, I worked with ChatGPT to create a comprehensive list of factors that can influence MCAS symptoms. From there, I translated those ideas into a spreadsheet and began tracking the things that seemed most relevant to my situation.
Over time I have continued to refine the spreadsheet, adding new metrics, removing things that weren’t useful, and adjusting categories as I learned more about my own triggers. The version I use today is the result of years of small improvements rather than something I got right on the first try.
This will make a copy a blank copy of the tracking spreadsheet in Google Sheets that you can edit yourself.
The spreadsheet tracks two primary things:
Symptoms
Potential Triggers and Environmental Factors
The goal is not to track everything perfectly. The goal is to collect enough consistent information to start identifying patterns.
With dropdown menus, conditional formatting, and automated formulas, entering a day’s worth of data usually takes me only one or two minutes.
In the next section I’ll show how I turn this raw tracking data into charts and visualizations that make relationships between symptoms and potential triggers much easier to spot.
Environmental Load: Turning Chaos into Something Measurable
Once I started to get a bit of a better understanding of which factors impacted my MCAS symptoms I wanted to create an intuitive way to easily compare the environmental conditions of one day to another.
To solve this problem, I created an Environmental Load score.
The Environmental Load score combines several environmental factors into a single number that represents the overall burden my environment may be placing on my body.
My current model includes:
The score is then adjusted based on how much time I spent outdoors, since exposure matters just as much as the environmental conditions themselves.
A high-pollen day spent entirely indoors is very different from a high-pollen day with a high PM2.5 level spent mowing the lawn.
The goal isn’t to create a perfect scientific model. The goal is to create a consistent way to compare one day to another.
Making Your Data Actionable
Collecting data is just the start. The real value comes from turning that data into information you can actually use to make decisions. Over time, I have found two approaches especially helpful:
1. Visualizing the data with charts
2. Using ChatGPT to help identify patterns
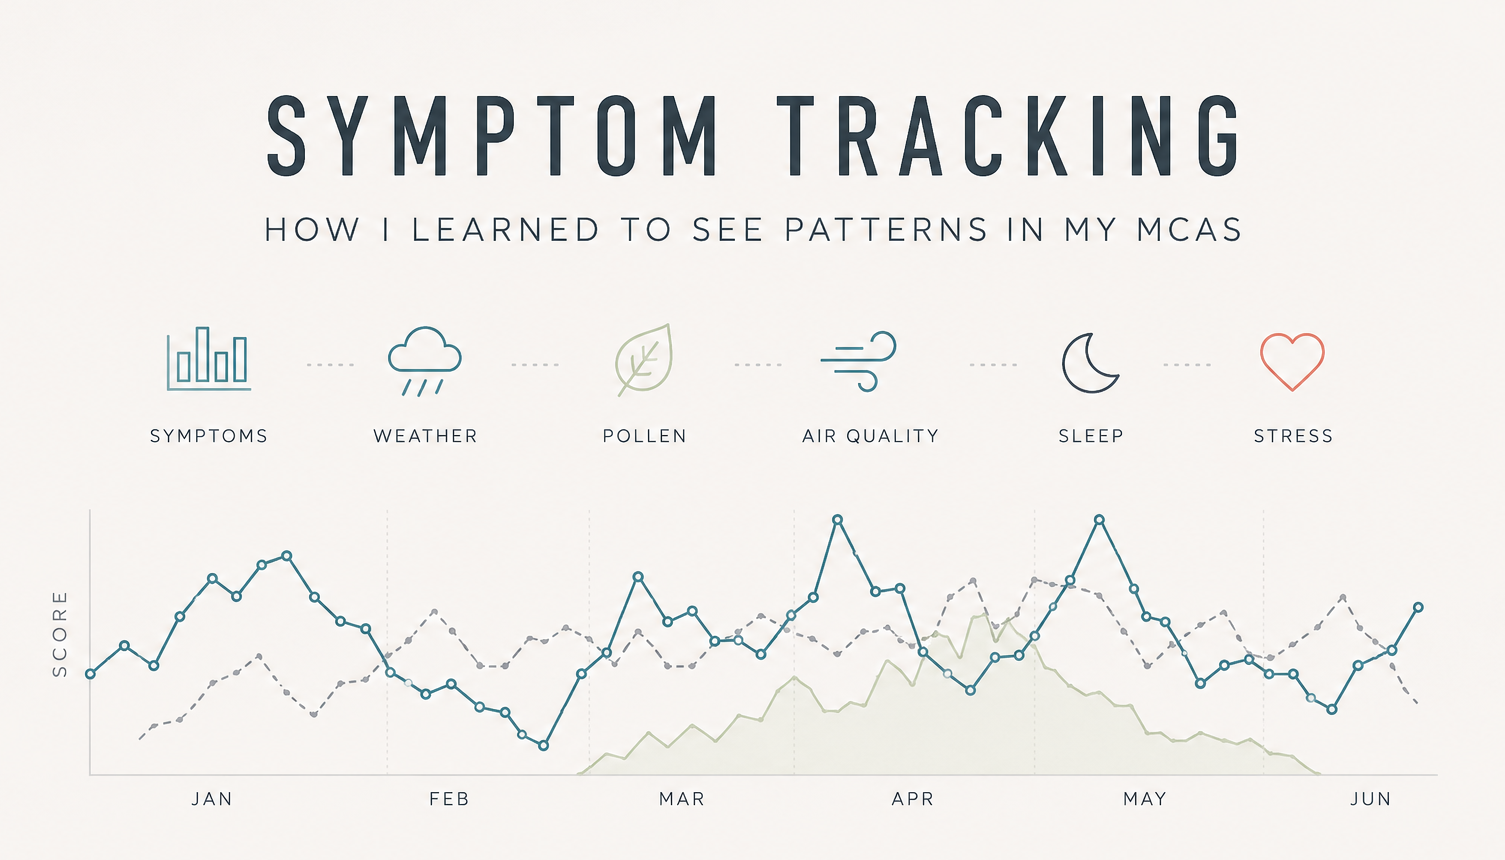
Visualizing Your Data
Looking at a spreadsheet full of numbers can be overwhelming, but a good chart can make relationships obvious in seconds. I was able to identify several trends that aligned with my lived experience, including:
strong correlations between worsening symptoms and pollen levels, as well as, correlations between improved symptoms and quality of sleep and rainstorms.
To create my visualizations, I use a free tool called Datawrapper.
Datawrapper pairs nicely with Google Sheets, allowing charts to update automatically as new tracking data is added. Once published, the charts can also be embedded on websites and shared with others.
This combination is how I built my Symptom Tracking Dashboard, which I continue to update as I develop new tracking methods and discover new relationships in the data.
Using ChatGPT to Find Patterns
The second approach I use is working with ChatGPT. Humans are excellent at noticing obvious patterns, but we tend to struggle when dozens of variables are interacting at the same time. Computers excel at this kind of analysis.
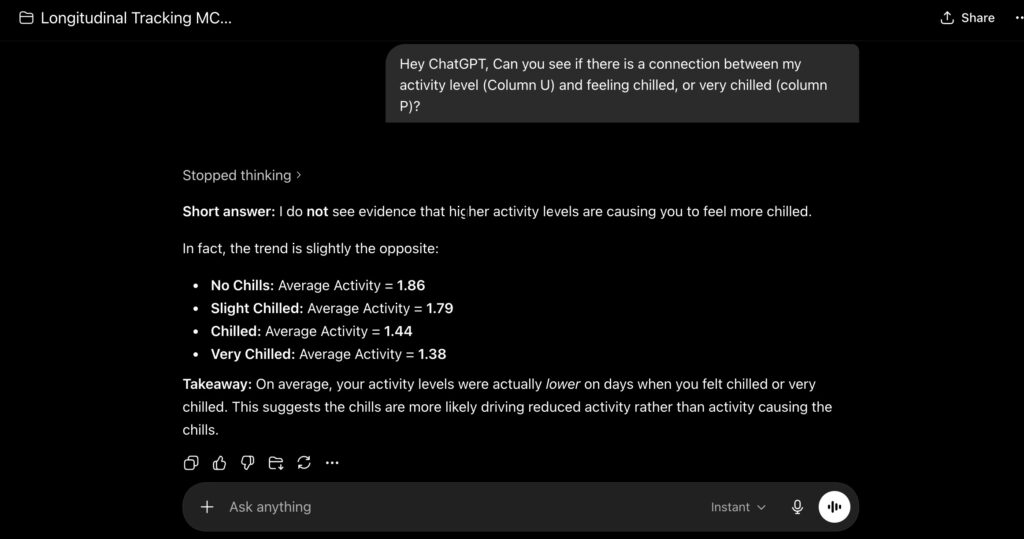
I began working with ChatGPT and my ttracking data by simply asking it to identify trends and patterns in my tracking data and I have been impressed with what it is able to discover. I still check in with ChatGPT from time to time to see if any new patterns have emerged. Below is the most recent example me doing just that:
I also use ChatGPT to help validate ideas that emerge from my own observations. Instead of asking: “What is causing my symptoms?”. I often ask: “Does the data support my theory that X is affecting Y?”
Most recently, for example, I investigated whether my activity levels were associated with how chilled my skin felt throughout the day.
Not every hypothesis turns out to be correct, but having a second set of analytical eyes helps me separate assumptions from patterns that are actually supported by the data.
If you are curious about how else ChatGPT can help, check out my article about creating predictive models with ChatGPT that can help. you be proactive when it comes to your MCAS symptoms and triggers.
A Few Words of Caution
Neither charts nor AI can prove cause and effect. They are tools for generating ideas, identifying relationships, and helping guide future investigation. The goal isn’t to replace medical advice or scientific research but instead to better understand your own experience and ask better questions.
Secondly, I always want to remind you that you get to decide the benefits vs the risks of sharing your personal medical data with an AI chat bot. It is a personal choice!